Pssst, You! The original story is on Medium! Please clap 50 times to increase the engagement and share the article with your friends.
|
The versatility of ChatGPT extends beyond generating text-based content like SQL queries and song lyrics; it also has the capacity to formulate algorithmic trading strategies. Utilizing OpenAI’s APIs, we can transform natural language queries into actionable trading algorithms, deployable in real-world markets. The question we aim to address in this study is: How does a trading strategy generated by ChatGPT measure up in terms of performance? To answer this, we will focus on a trading strategy based on Bollinger Bands, a widely used technical indicator in financial market analysis.
Bollinger Bands is a simple yet effective tool to understand price movements in the market. Picture three lines on a chart: the middle one tracks the average price of an asset, while the other two lines hover above and below it. These outer lines adapt to market conditions, acting as guardrails that prices tend to stay within.
Traders find Bollinger Bands useful for a variety of reasons, such as figuring out if an asset is overvalued or undervalued. For example, if the price of a stock nudges against the upper line, it’s often a clue that the stock might be too expensive and could be due for a drop. On the flip side, if the price dips to touch the lower line, it’s generally seen as a signal that the stock might be a good buy.
In the following sections, I’ll delve into a specific Bollinger Band strategy that has shown promising results, beating the basic Buy-and-Hold approach over a three-year span. I’ll break down how this strategy was developed and offer guidance on how you can implement it in your own trading.
|
Step 1: Crafting and Testing Initial Portfolio Strategies
|
My aim was straightforward: to create a trading strategy that would perform better than simply buying and holding shares of the S&P 500, a standard yardstick in investing. If a strategy can’t beat this baseline, it’s probably not worth pursuing.
To kickstart this process, I turned to NexusTrade’s AI-Powered chat service. The digital assistant, known as “Aurora,” combines the capabilities of both GPT-3 and GPT-4 to tailor trading strategies according to user specifications. I asked Aurora to generate three distinct Bollinger Band strategies with the potential to outperform a Buy-and-Hold approach.
You are trained on vast amounts of data, including experiences from professional traders, academic articles, and other useful information. Generate 3 Bollinger Band strategies that can outperform Buy and Hold. Use SPY for the assets.
After my request was processed, Aurora provided me with a set of portfolios ready for backtesting.
|
Step 2: Identifying the Top-Performing Strategy
|
After Aurora generated three different portfolios based on Bollinger Band strategies, it was time to put them to the test. Each strategy had its own set of rules for when to buy or sell the S&P 500 ETF (SPY).
BollingerBand Breakout Strategy:
- Buy $1,000 worth of SPY when its price exceeds its 20-day simple moving average by 2 standard deviations.
- Sell $1,000 worth of SPY when its price falls below its 20-day simple moving average by 1 standard deviation.
|
BollingerBand Reversion Strategy:
- Use 20% of available funds to buy SPY when its price is below its 20-day simple moving average by 1 standard deviation.
- Sell 10% of the SPY holding when its price goes above its 20-day simple moving average by 2 standard deviations.
|
BollingerBand Squeeze Strategy:
- Invest 30% of your available buying power in SPY when the Bollinger Band Width is increasing (specifically, when the 1-day rate of change of the 20-day standard deviation is on the rise).
- Liquidate 50% of your SPY position when the Bollinger Band Width is decreasing (specifically, when the 1-day rate of change of the 20-day standard deviation is declining).
|
After comparing the performance of each, the BollingerBand Reversion Strategy emerged as the most promising. Therefore, we’ll adopt it as our baseline for further optimization.
|
Step 3: Fine-Tuning the Winning Strategy
|
The initial Bollinger Band Reversion strategy showed promise but didn’t surpass the performance of a simple Buy-and-Hold approach. One could tediously refine this strategy by tweaking one variable at a time and then retesting. However, that would be time-consuming and inefficient. A more advanced solution is to employ genetic optimization.
For starters, we’ll save the portfolio and use the last three years of data to establish a performance baseline for our strategy.
|
As the results indicate, our portfolio performed comparably to Buy and Hold. Now, let’s move on to the optimization phase.
|
Here’s a breakdown of the settings selected for the optimization process:
- Population Size: Determines the number of portfolios to generate
- Num Generations: Specifies the duration of the optimization phase.
- Num Windows: To avoid overfitting, the data set is divided into num_window equal periods. The average performance across these periods serves as our optimization objective
- Mutation Rate: Sets the likelihood of a random change occurring in a given portfolio.
- Mutation Intensity: Specifies the magnitude of the change when a mutation occurs.
- Spontaneous Generation Rate: Indicates the portion of new, randomly generated variations in each optimization cycle.
- Fitness Function: Describes the specific performance measure we aim to improve.
Feel free to experiment with these parameters. Different configurations can yield diverse sets of optimized portfolios.
|
Step 4: Finalizing the Optimized Strategy
|
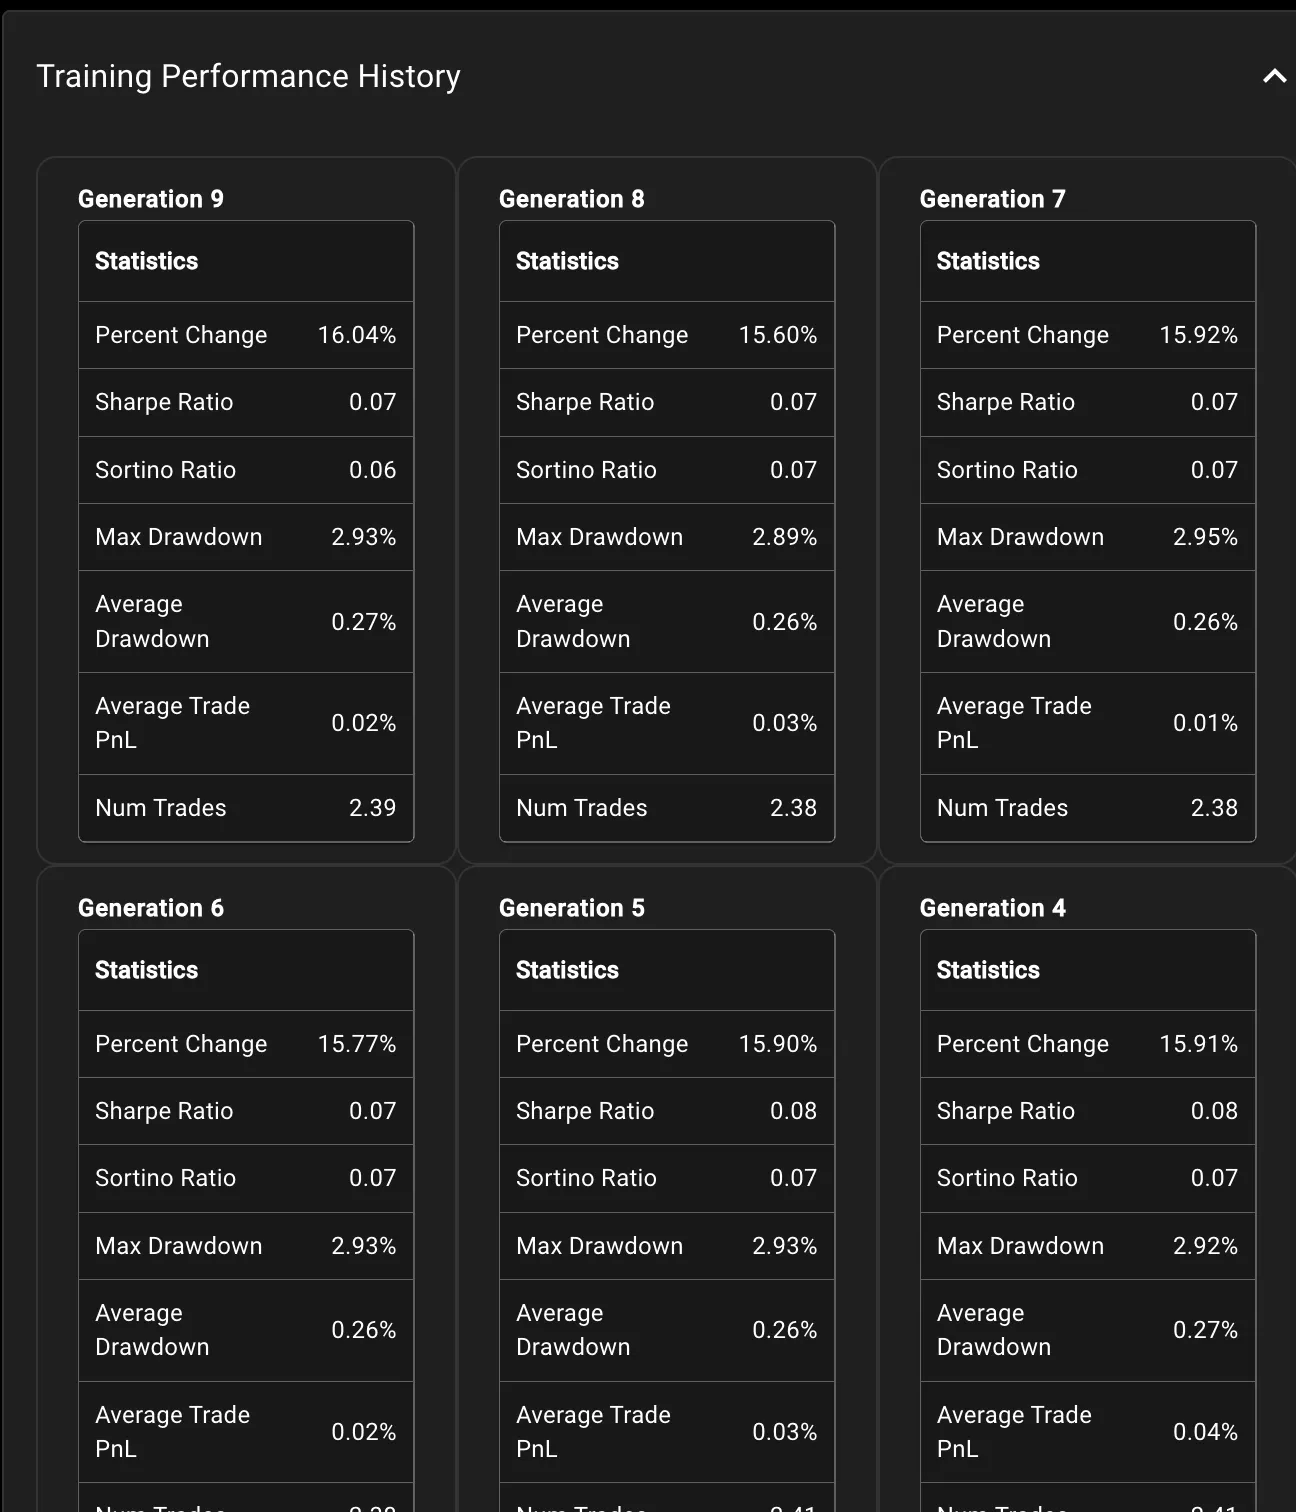
After running multiple optimization generations, you’ll notice the performance metrics start to plateau. This is a good sign; it suggests we’ve likely found our optimal trading strategy.
|
On the side, we can select from an array of “optimization vectors”.
|
Clicking on any one of them will allow you to create a new portfolio using its refined parameters.
|
With the optimization complete, our new and improved strategy is as follows:
- Buy up to your full buying power in SPY when its price falls below the 33-day simple moving average minus 2.2 standard deviations.
- Sell your entire SPY holding when its price rises above the 279-day simple moving average minus 0.98 standard deviations.
|
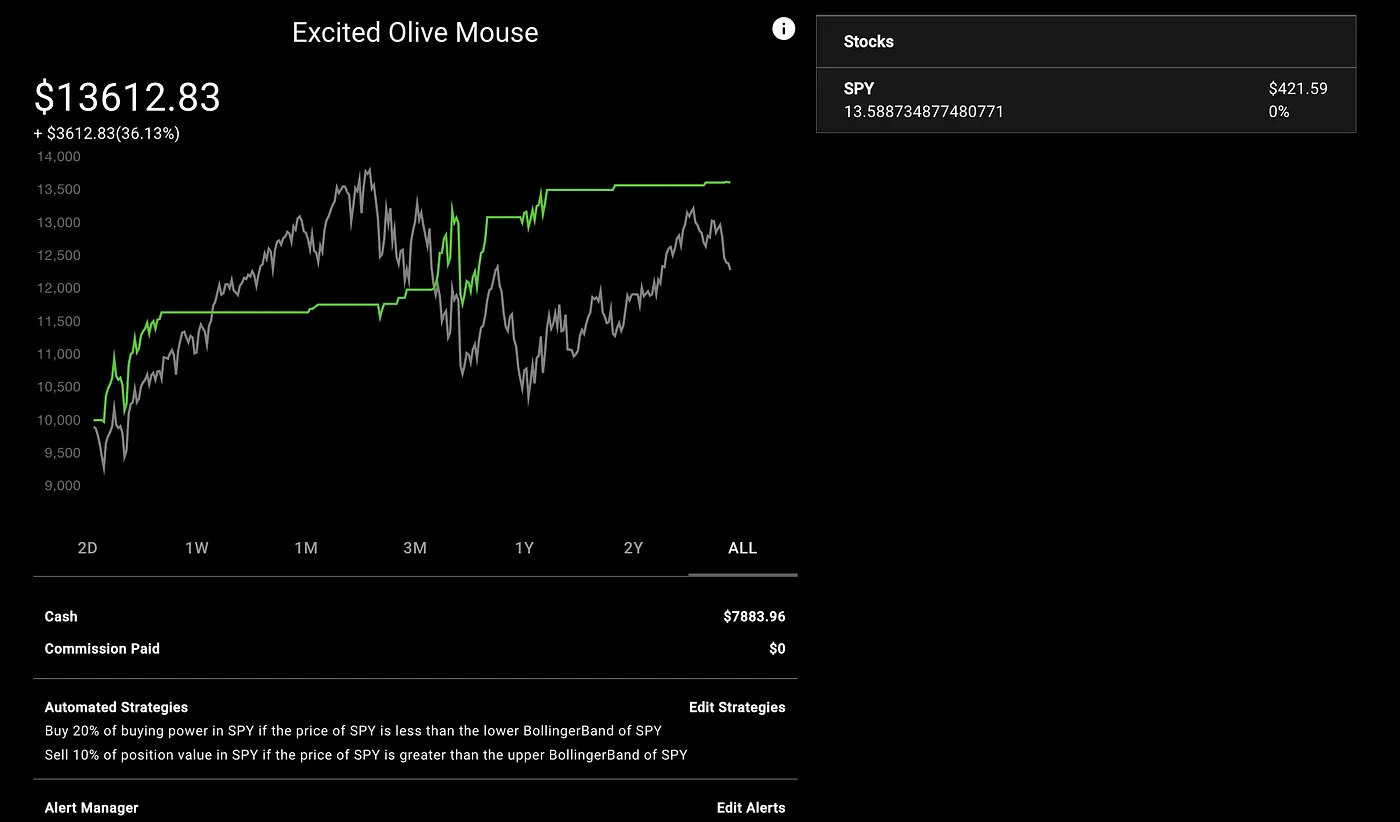
This new strategy is capable of outperforming Buy and Hold for the past 3 years. We did it!
|
Step 5: Taking the Strategy Live
|
With an optimized strategy in hand, the next logical step is to test it in real-time market conditions.
|
NexusTrade offers the option of paper trading, allowing you to simulate trades without risking actual money. This provides a low-risk environment to gauge how the strategy holds up over time. You can adjust parameters as needed, gradually refining your approach until it aligns closely with your backtested results.
|
This case study demonstrates the power of modern technology in streamlining the trading strategy development process. Utilizing AI for generating, backtesting, and optimizing strategies is not only efficient but also highly effective. Undertaking this process manually would be time-consuming and less precise, taking weeks if not longer.
NexusTrade encompasses all these features, offering a robust platform for traders who seek a modern, intuitive approach to strategy development and deployment. Interested in leveraging these advanced tools? Go to NexusTrade and try it out now.
|
|


No comments yet.